With digitalization gaining pace, we can safely call information the new oil of the 21st century. And, if data is fuel, analytics is the combustion engine of a successful business, regardless of industry. When it comes to eCommerce, accurate reporting is critical, especially if you sell on a highly saturated marketplace like Amazon.
Actionable data insights help merchants win their market share and spot opportunities for improvement, mapping their marketing strategies accordingly. With that in mind, Amazon has made several updates to its Brand Analytics feature, unveiling additional analytics tools and eliminating some others to help sellers turn their Amazon data into strategic assets.
This article breaks down how to use the updated Amazon brand analytics dashboard and uncovers the key metrics you should keep track of to boost your brand performance.
But before we take a closer look at the reports offered within the Brand Analytics dashboard, let’s talk about why Amazon business data management and analytics are important.
First Things First: Why Is Analytics Critical for Your Amazon Business?
Since no one can hit their target with their eyes closed, online sellers can’t go without credible data and the powerful insights derived from it. In terms of Amazon sales, the better your product data quality is, the better product pages tend to perform.
For those who want to grow and expand their business on Amazon, retail analytics is key.
At Seller Labs, we know the value of your data, and appreciate the time you take to collect and interpret it. This is why we rolled out a powerful data aggregation and data management tool capable of combining all your Amazon data from various sources into one reliable database automatically — Seller Labs Data Warehouse.
With single-view access to your Amazon business data, you can:
- identify best-selling products
- determine top-performing advertising campaigns
- analyze sales data
- stay ahead of your orders with inventory and order management
- determine the areas of your business that need improvement
Our Data Warehouse helps brands get an instant, holistic view of their Amazon businesses. Furthermore, with our new Google Sheets extension, you can customize your Amazon Data in a Google Sheet right from within Seller Labs PRO. Currently in beta, this feature will help you save time, money, and energy with better reporting and data automation.
Keep Tabs on Your Data with Seller Labs Data Warehouse
Not managing your product data effectively can lead to undesired actions, like cart abandonments, poor product discoverability, and a drop in sales. In contrast, a well-performed Amazon sales data analysis enhances the entire online business performance by driving conversions, winning the top spot in the Amazon search results, and tracking buyers’ behavior. And this is where we are coming closer to what data Amazon Brand Analytics provides.
What Is Amazon Brand Analytics?
Amazon Brand Analytics (ABA) is an exclusive suite of reports for brand owners that unlocks actionable insights into buyers’ purchase behavior and browsing patterns.
With the Amazon Brand Analytics tool, Amazon sellers can make informed decisions and improve the overall brand performance by accessing the following reports:
- Amazon Search Terms
- Demographics
- Market Basket Analysis
- Repeat Purchase Behavior
- Search Catalog Performance
- Search Query Performance
Side note: Effective June 30, 2022, the Item Comparison and Alternate Purchase Behavior Report within Amazon Brand Analytics is no longer available. According to seller feedback, these dashboards didn’t offer impactful and actionable insights, so Amazon eliminated them, exploring further opportunities to add deeper customer behavior analytics in 2023.
Although there was no official announcement from Amazon, rumor has it that Amazon Search report will also be deprecated soon in favor of the newly-launched Amazon Search Analytics.
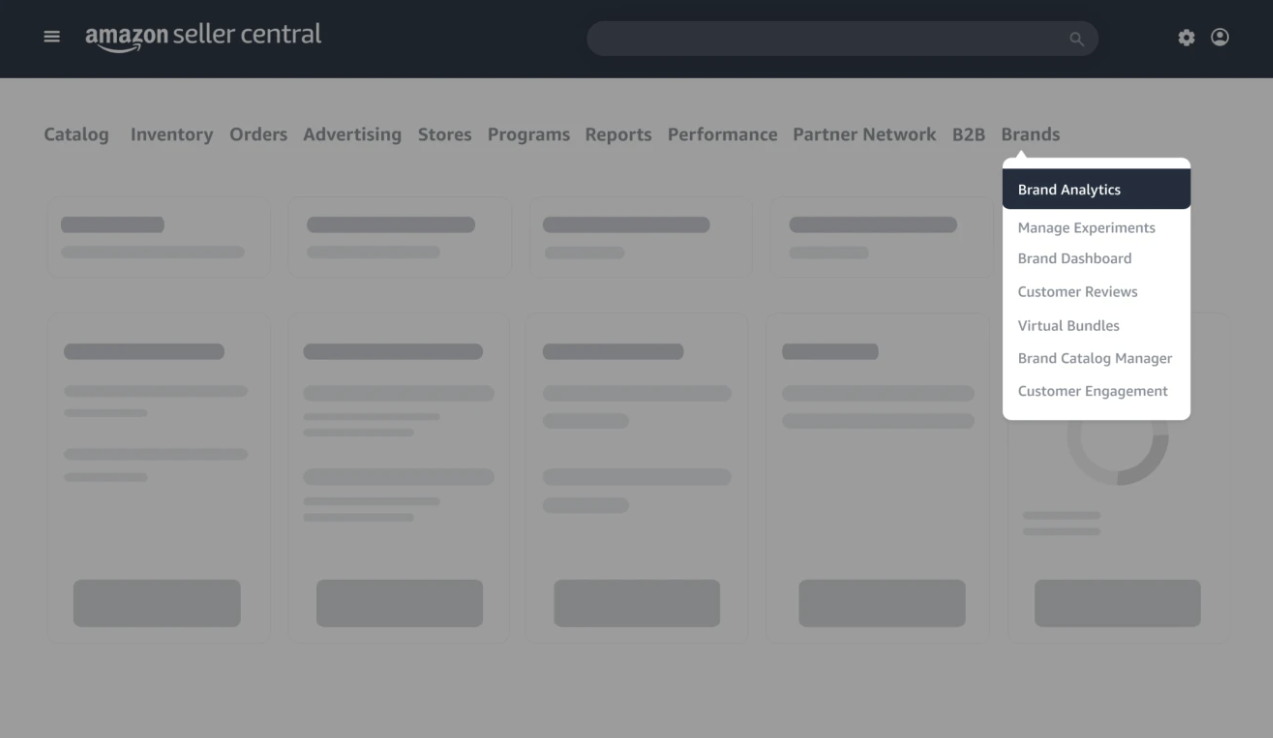
This enhanced analytics feature is available to sellers who own or are internal to a brand on Amazon and are enrolled in the Amazon Brand Registry program. Registered brand owners can access these reports through their Seller Central home page by hovering over the “Brands” tab and clicking “Brand Analytics” in the drop-down menu.
An Overview of the Main Brand Analytics Reports
Amazon Search Terms Report
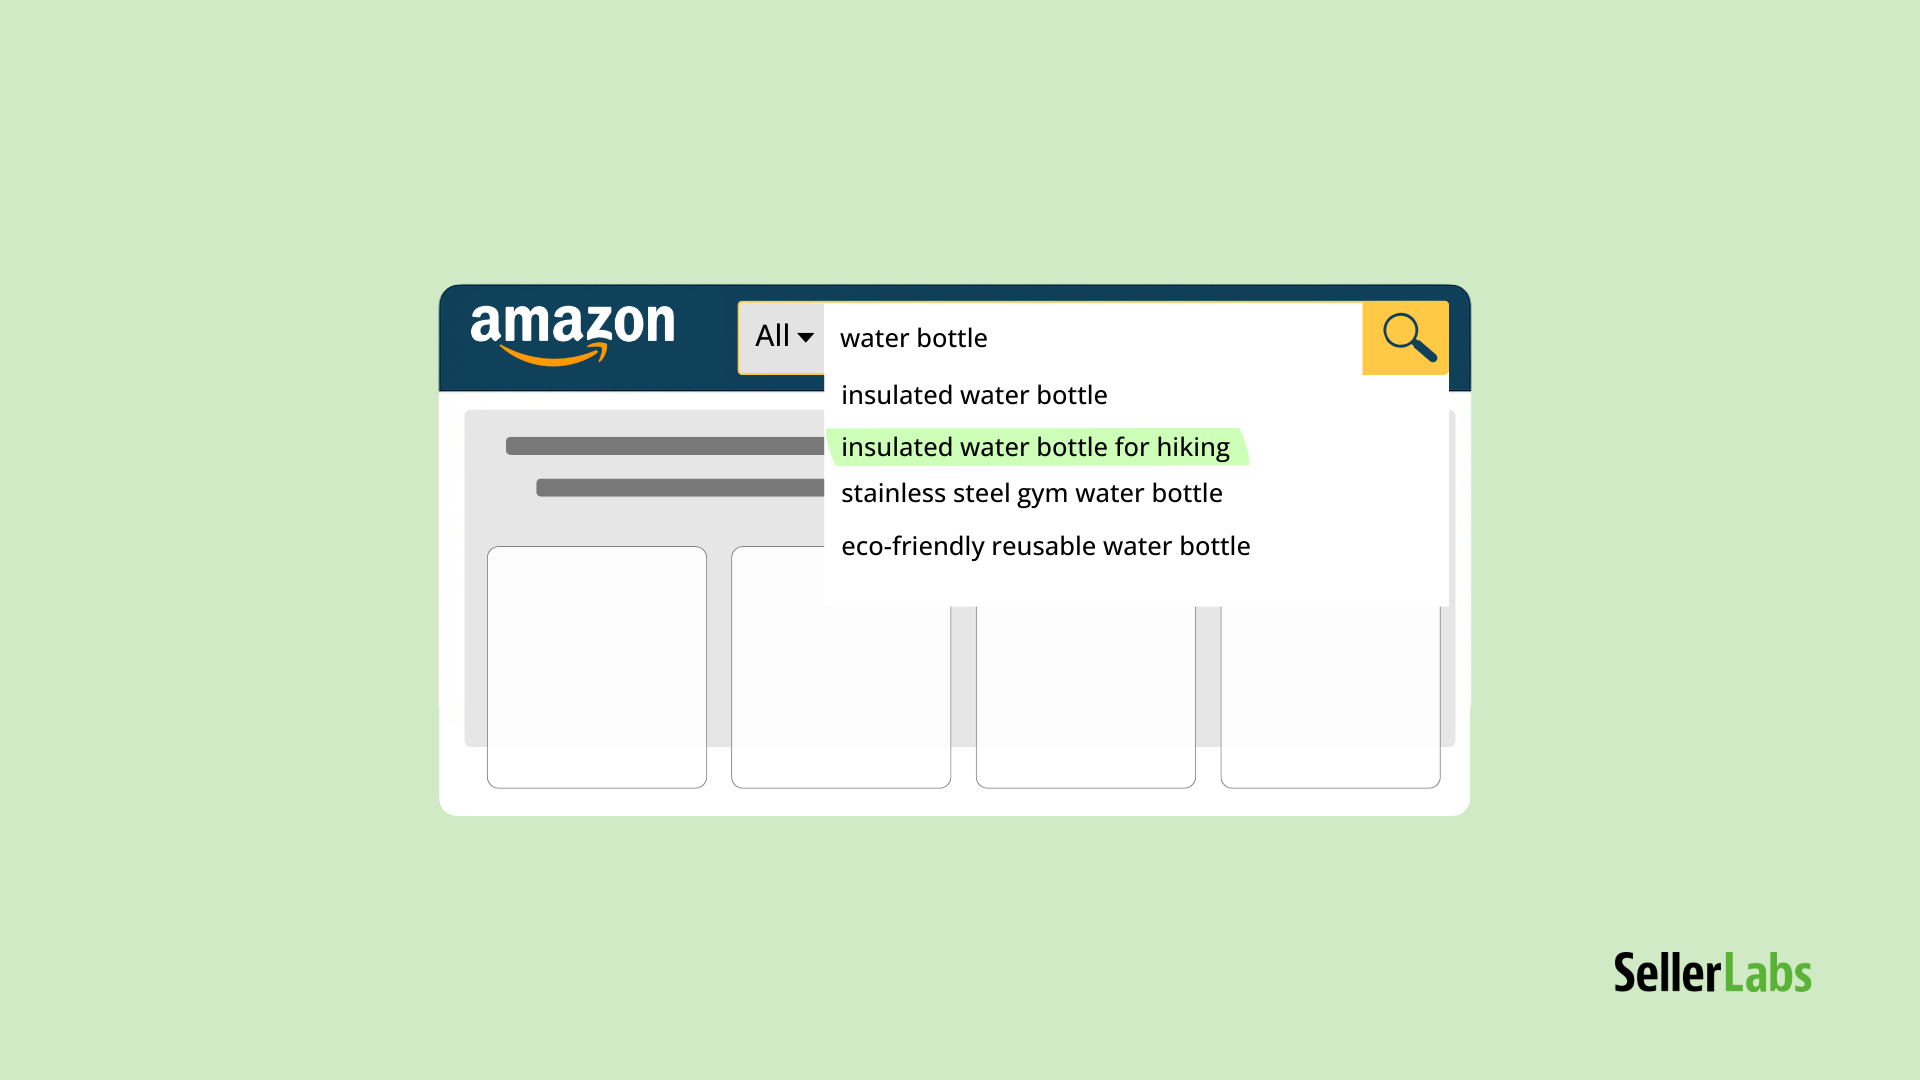
Let’s face it: you can’t build long-term brand awareness on wild guesses. Therefore, knowing what shoppers type into the Amazon search box while browsing for your products is critical. The Search Terms report shows the keywords that potential Amazon customers enter to buy your products. Furthermore, it allows merchants to see the search terms shoppers use to find their competitors’ items and see what percentage of the time their competition is getting clicked.

The crucial metrics available via this report are:
- Search terms and the matching products that customers purchase.
- Search frequency rank (SFR) is the numeric rank of a search term’s popularity, contrasted to other search queries over a specified period. The lower the SFR, the more popular a search term is to shoppers.
- Click share determines the percentage of clicks the product got compared to the total clicks based on the search results in the selected time frame.
- Conversion share indicates the percentage of customers who bought the product after searching for a particular term.
- Clicked ASIN shows the top three product ASINs that are most clicked for each search term that customers type into the Amazon search box.
- Product title displays the product headline that received the most clicks for a given search term.
The Amazon keyword search report is an excellent resource for uncovering additional search phrases, the most popular goods listed for every search term, and the frequency of these specific terms. With this knowledge, sellers can improve their product listings by targeting these keywords and optimizing descriptions on the product detail page to generate more traffic.
Demographics Report
The Demographics dashboard* allows brand owners to enhance their marketing efforts based on customer penetration by demographic. It provides the aggregate breakdown of product purchases by customer location, gender, age, household income, and marital status.
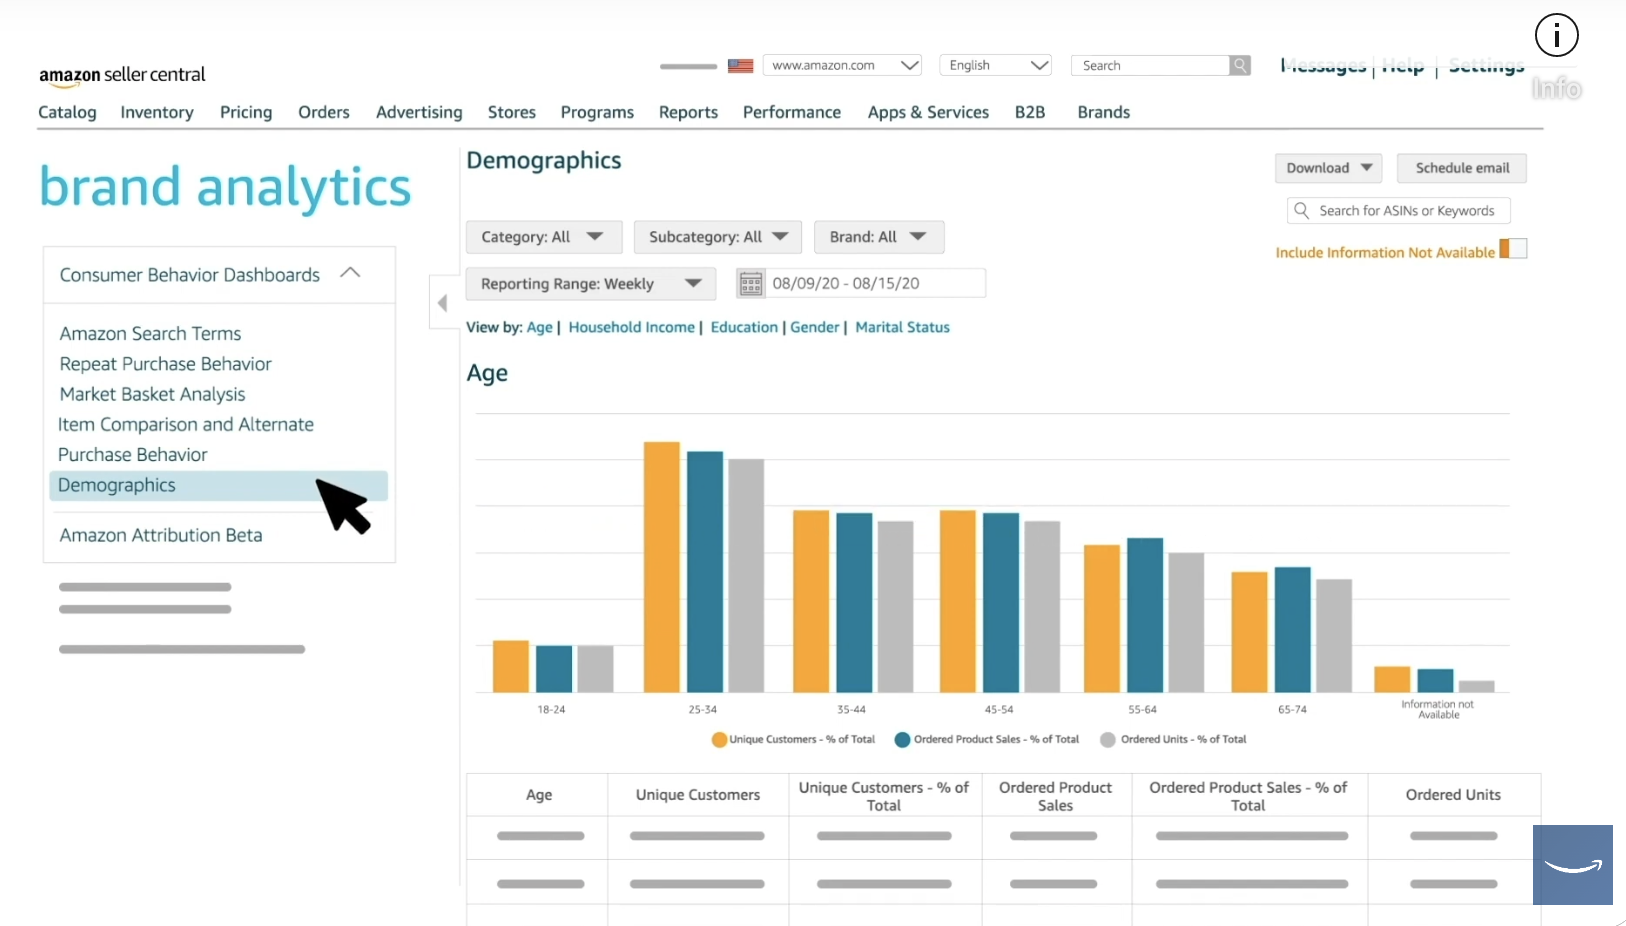
Sellers can view critical metrics such as the number of unique customers, ordered product sales, and ordered units for each demographic segment. This data helps you understand your main buyer persona and determine more efficient targeted marketing campaigns.
*The Demographic report is only available to brand owners in the United States.
Market Basket Analysis Report
With the Market Basket report, merchants can see related products shoppers frequently buy in conjunction with the primary item.

Here are the main three metrics of this report:
- Purchased ASIN is the product that customers frequently buy along with yours.
- Purchased Title shows the title of the Purchased ASIN associated with your brand product.
- Combination % is the percentage of orders that contain both the brand owner’s listed product and the competitor’s most purchased product.
Side note: The following formula calculates the combination percentage:
Orders containing both the product you offer and the related product divided by the total number of orders and multiplied by 100
For example, 2,000 orders out of 5,000 total contain the mobile phones you sell plus the memory cards. Then your combination percentage will amount to 40%.
The higher the Combination %, the more frequently your products are bought together with the listed product. Please note that this metric isn’t helpful unless your product has a high sales volume.

If you have one sale and try to view the dashboard, that one sale may not have had any associated purchases, so there will be no data. If you have ten sales, you may have one sale with related purchases, but one out of ten isn’t a good indicator that these items are actually commonly purchased together. But if you have 1000 sales and 500 of those have associated purchases, you’re finally seeing some data that could help you understand what products are commonly purchased with your items.
This data helps brand owners generate complementary product ideas to create new bundles and increase cross-selling, ultimately leading to a higher average order value (AOV).
Repeat Purchase Behavior Report
As the name suggests, this report allows sellers to identify the products most likely to be purchased repeatedly. It also indicates the number of unique customers and the percentage of shoppers who bought the product several times.
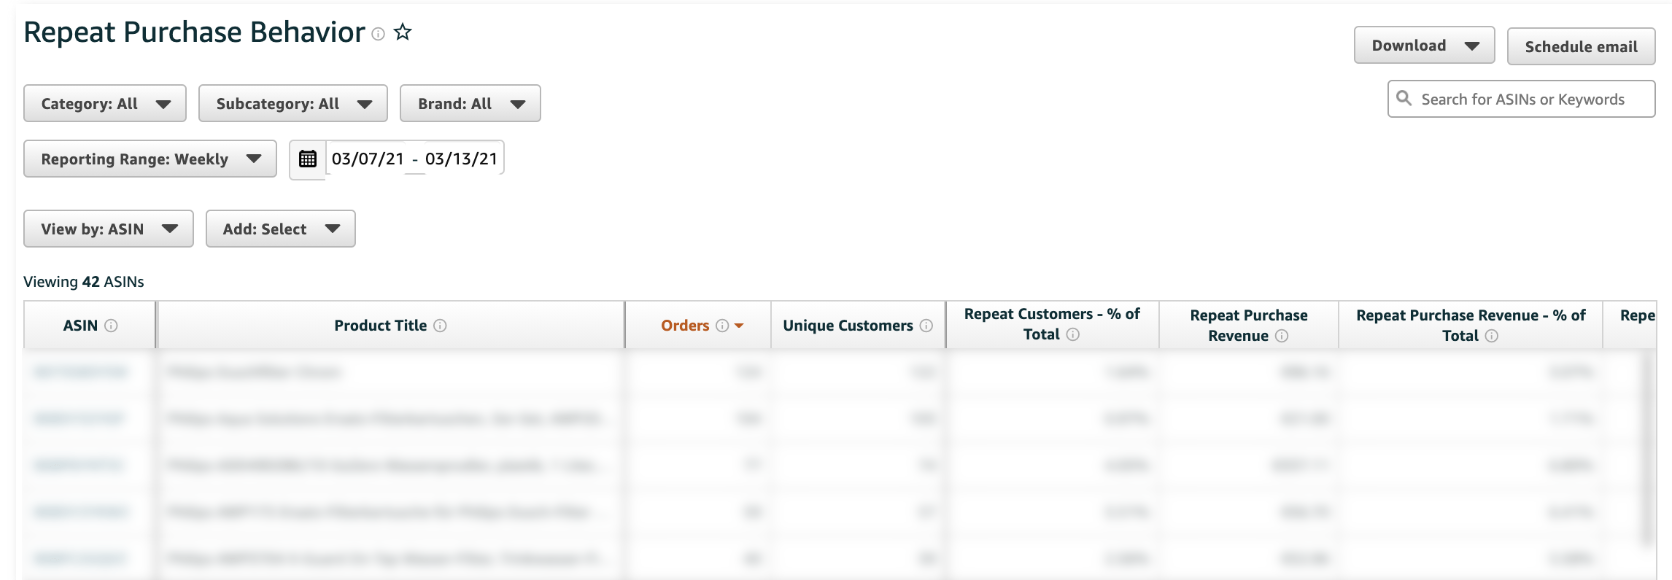
In this report, you’ll find:
- Number of orders for a product
- Number of unique customers who purchased that product
- Number of repeat customers (as a percentage of the total number of customers)
- Sales amount from repeat purchases
- Percentage of orders containing repeat purchases of the product
Knowing which of your products are bestsellers gives you an insight into how to manage your inventory more effectively, allowing you to avoid expenses on the items that don’t sell well and invest in the products that better match buyers’ preferences.
Amazon Search Analytics Dashboard
On top of the reports mentioned above comes the recently unveiled Search Analytics dashboard. Available under the Brand Analytics tab, this tool gives sellers valuable insights into their product search performance.
The main features of this new dashboard are the Search Query Performance and Search Catalog Performance reports that are currently available in the U.S. only.
Search Query Performance Dashboard
This report helps brand owners understand their customers’ shopping behavior across the entire shopping journey by analyzing the performance of the top queries relevant to their brand. The data is available for three reporting periods: weekly, monthly, and quarterly.

Key data available from the search query performance report include:
- Query volume is the number of times the query was searched for a given time period.
- Impressions are the number of results that pop up when a shopper runs a search on Amazon.
- Clicks measure traffic, indicating how many shoppers interact with your products after a specific search query.
- Brand share presents the total of clicks and impressions that your brand gets.
- Cart-Adds show how often shoppers add your brand’s products to their cart after performing the search query.
- Purchases indicate the number of conversions per search query.
With the Search Query Performance report, merchants will access paid and organic data for each search query and get a 360-degree view of their keywords and search terms’ performance. With these insights, you can understand the competitive landscape and meet customer intent by updating your listings for SEO to get more organic traffic. The search query data also helps sellers catch trends early and identify opportunities to introduce new products.
Search Catalog Performance Dashboard
While the Search Query Performance tool provides you with information that led to your brand interaction for the first 1,000 search queries, the Search Catalog Performance report shows you the same KPIs (impressions, clicks, cart-adds, and purchases), but this time at the product level.
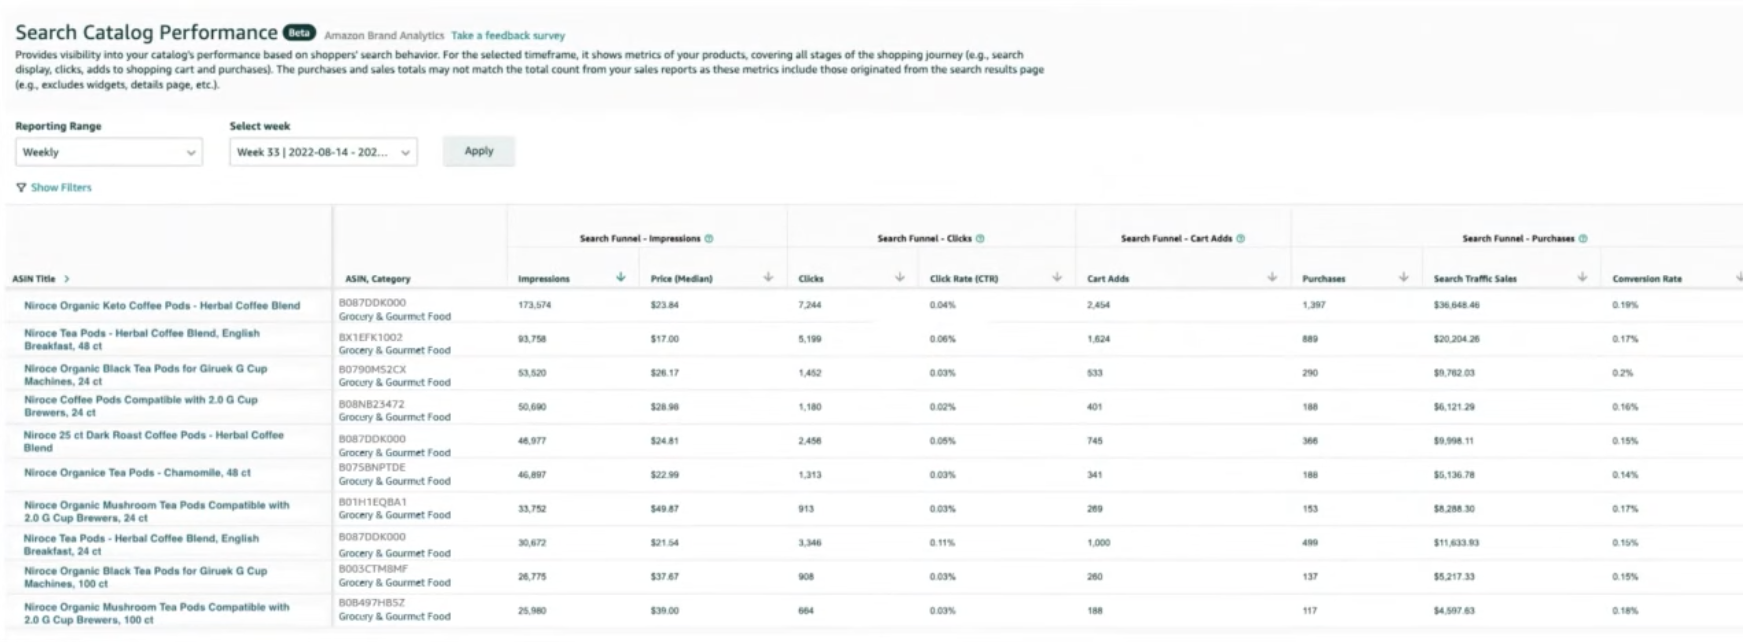
With this data, merchants get deeper insights into each stage of their products’ sales funnel to identify main conversion issues and drop-off points. For example, after spotting a poorly performing product, they can investigate the potential purchase barriers, adjust a competitive price, and optimize the product detail page content, ultimately improving conversion rates.
Important note: Some sellers may notice that the search total sales do not match the sponsored product sales or order reports.
And here’s why:
The total purchases attributed to organic and sponsored in the Catalog Performance Dashboard use a 24-hour period attribution meaning the impressions clicks, cart-adds, and purchases should have occurred within this timeframe. This is different from how all other dashboards’ metrics are calculated. While comparing two different dashboard data sets, please note that the search traffic sales are not your total sales number, but the sales number originated from the search results.
Recent & Upcoming Amazon Launches
Amazon is planning to roll out some additional features and tools as part of the Amazon Brand Analytics Dashboard by the end of this year.
1. Product Opportunity Explorer helps Amazon sellers better understand buyers’ needs and purchase behavior to identify the unmet customer demand and generate new product ideas. This feature is only available to registered brand owners. They can access the tool by opening the Seller Central main menu, hovering over to “Growth”, and selecting “Product Opportunity Explorer”.
To help you unlock new product opportunities, the tool collects the search terms and products to define market niches representing the specific customer need. Each niche has a detail page providing additional information like products within the niche, search terms, and statistics about new product launch potential. Niche metrics are refreshed at the beginning of each week, and new niches are created at the start of each month.
Sellers can find the niche of their liking with the following filtering options:
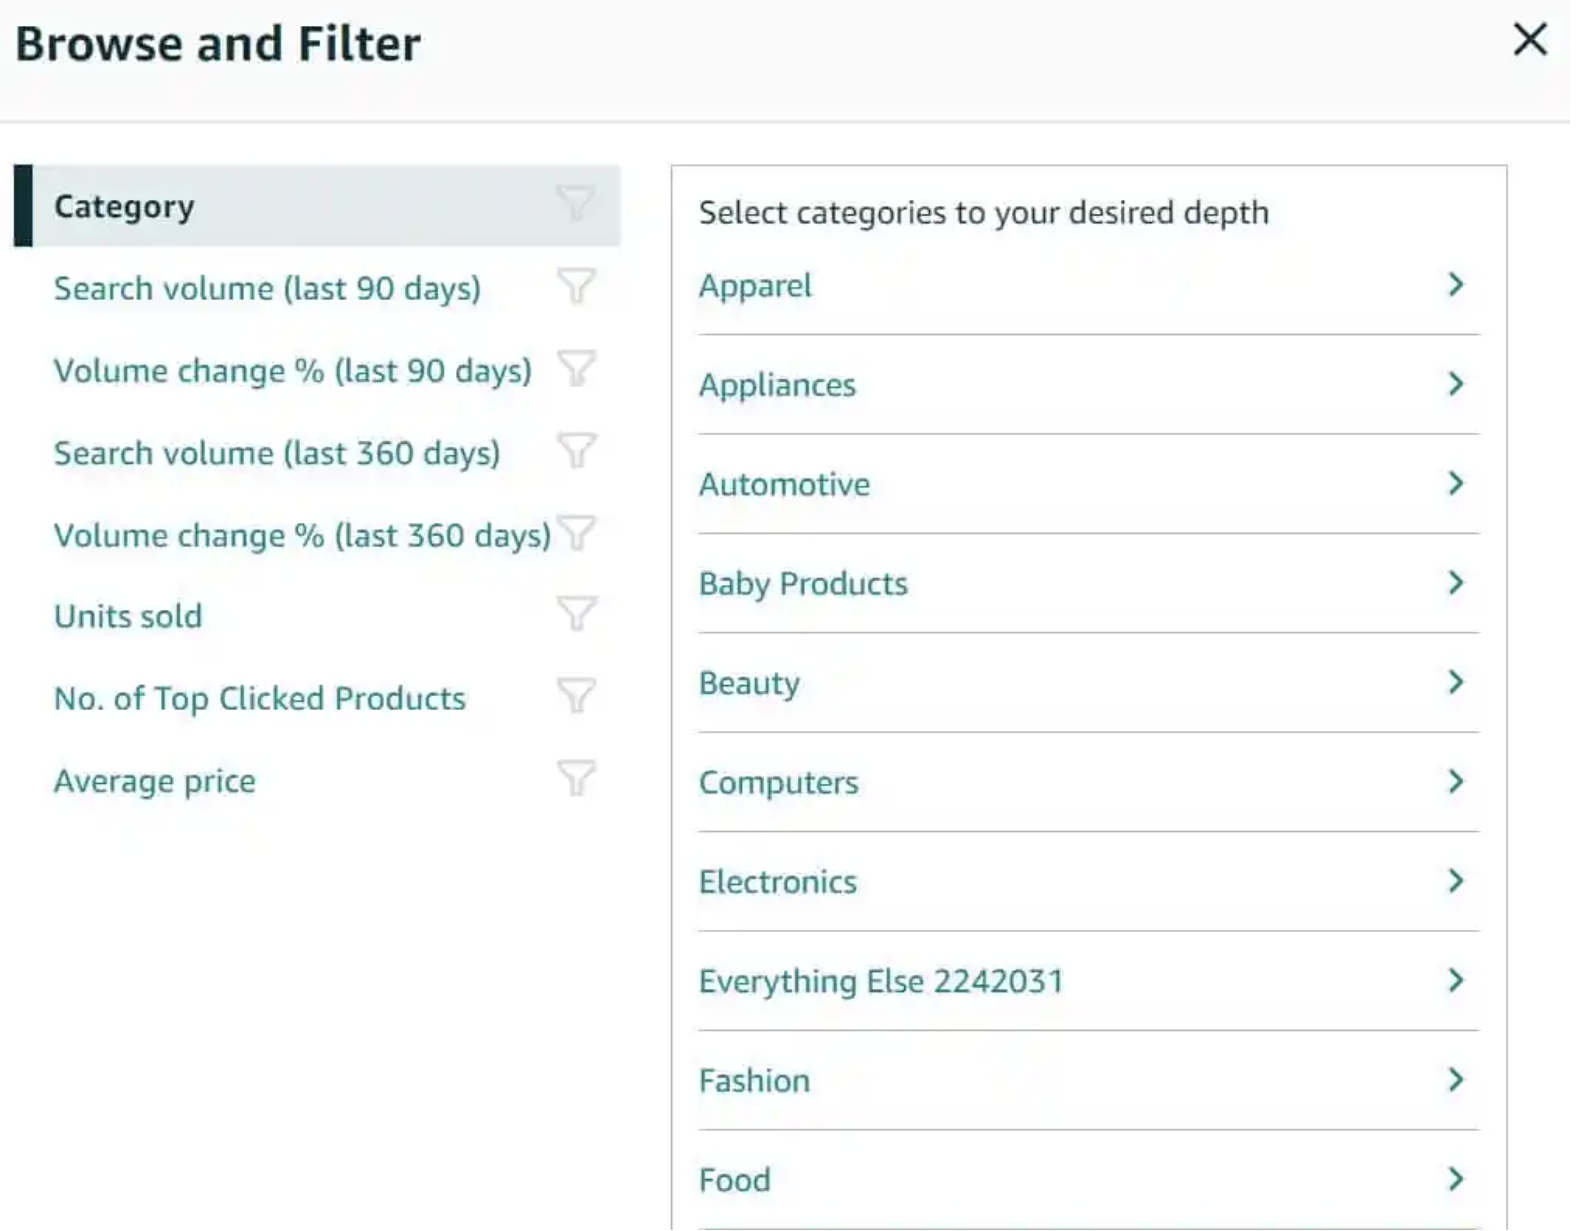
With Product and Opportunity Explorer, brand owners can analyze the intensity of competition and see which niches are not filled yet to introduce new products there.
2. Search Metrics Glossary will help merchants understand what the metrics mean and how they are calculated to interpret and implement the data more efficiently.

The glossary will be easy to find from different points of access across the dashboards, and it will include a detailed explanation of each metric, as you can see in the example for the Purchases Total Count:

3. Query Performance ASIN View is part of the Search Query Performance dashboard, which helps sellers understand the customer demand and the performance of each of your products.
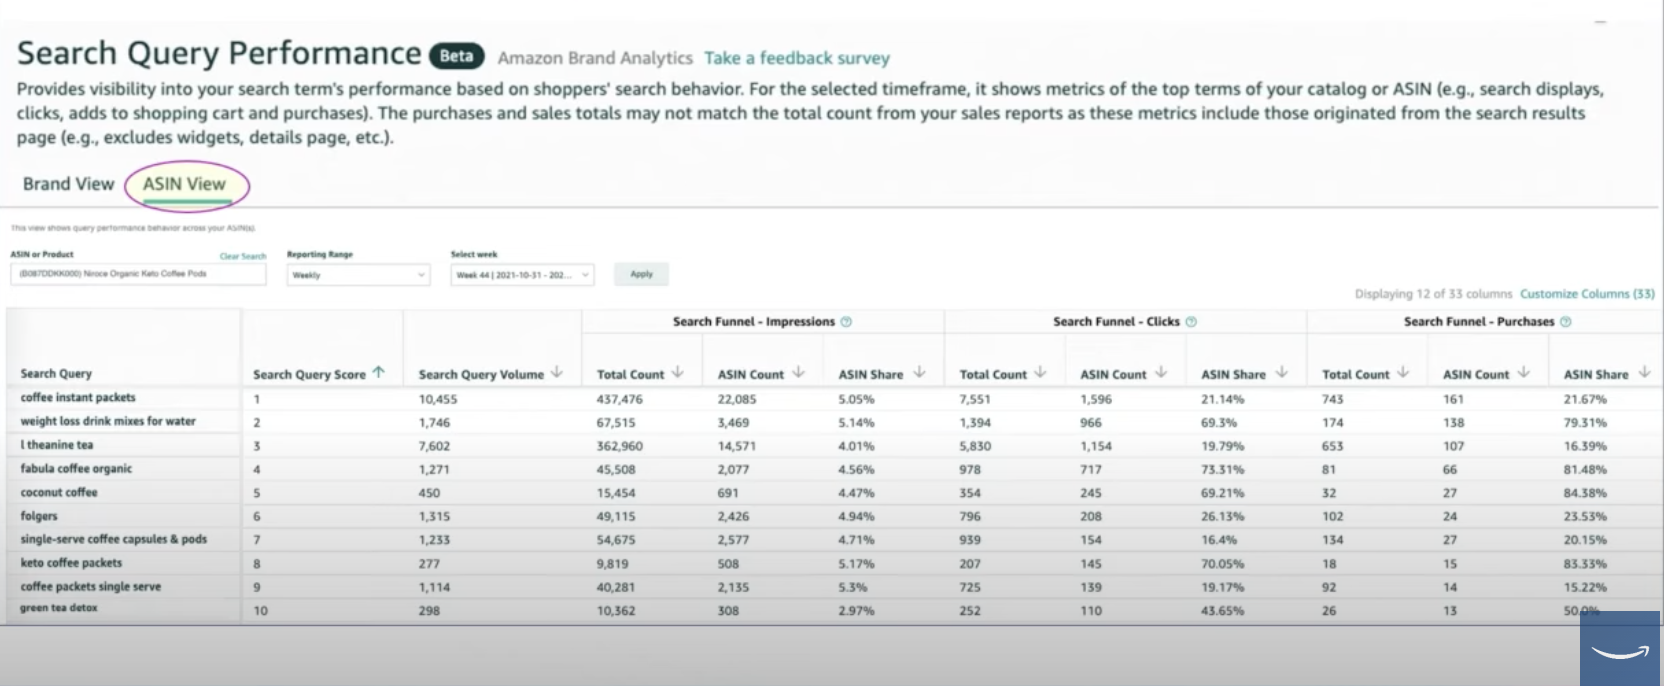
This dashboard includes the same number of metrics as the brand view and shows the top search queries associated with the selected ASIN. With this information, merchants can enhance their product listing based on the search terms used in the query.
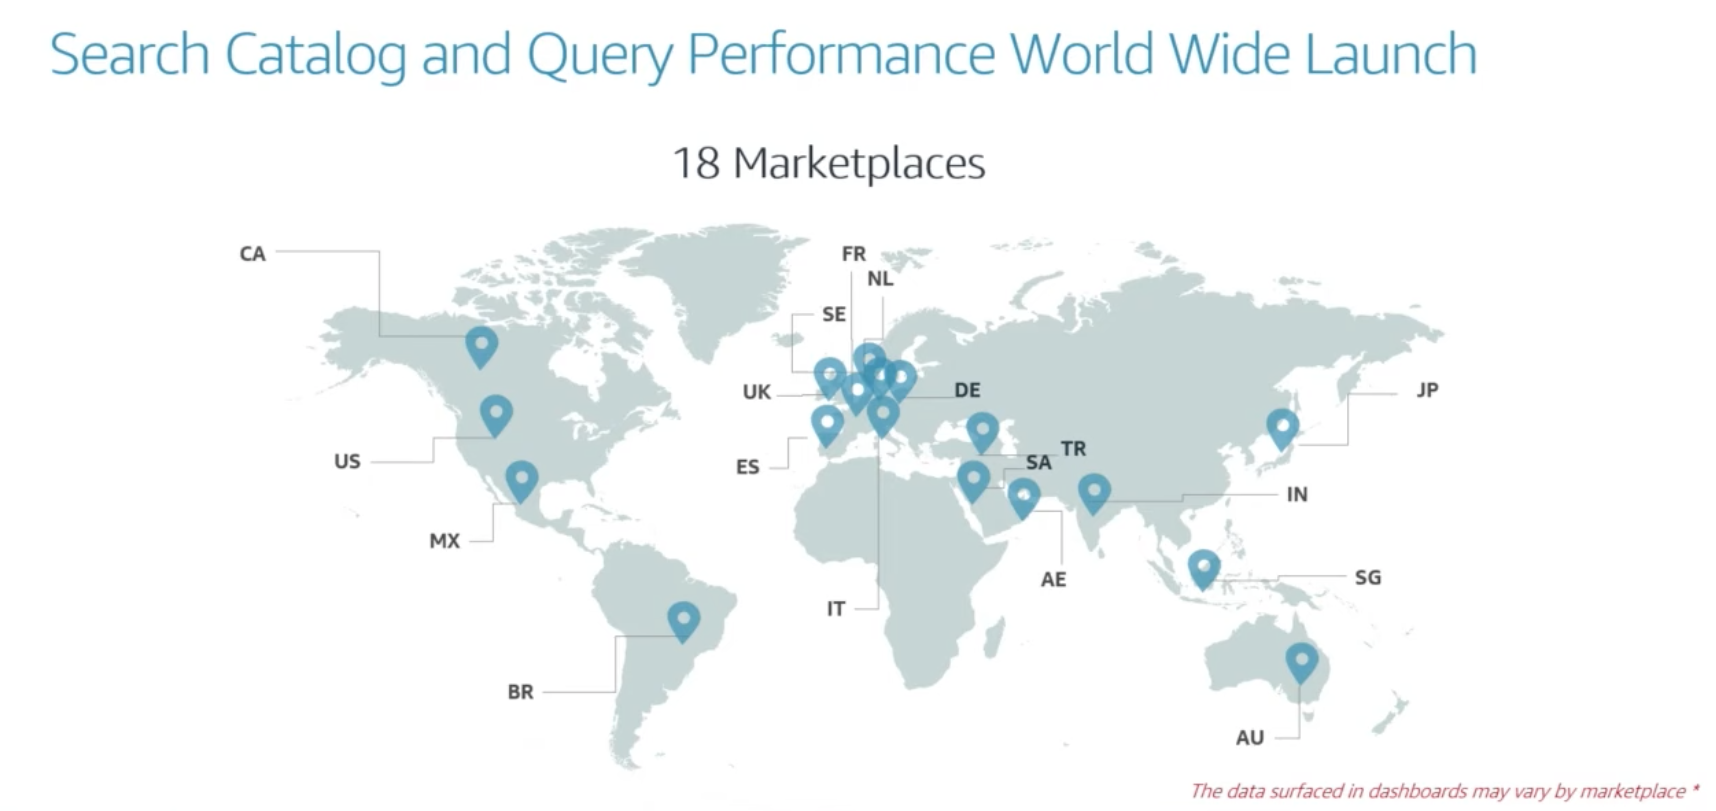
4. Search Dashboards Worldwide Launch. Amazon is planning to expand access to Search Query Dashboards to eighteen marketplaces one at a time by the end of the year.
5. Downloads and Insights. Merchants will be able to export search performance datasets to infer trends and insights with all the required information at hand.

Amazon says there will be two download options:
- Simple View will include data displayed in the dashboard according to your selected filters and columns.
- Comprehensive View will consider only two filters: brand and reporting range. It will include many more queries than a thousand-limit imposed by the UX.
The initial release will allow sellers to download data in the CSV format, but Amazon is also planning to expand to other formats, such as Excel, in the future.
FAQs
Yes. Brand owners can use Amazon Brand Analytics absolutely for free. The only eligibility requirement is to be enrolled in the Amazon Brand Registry program.
The reports include only the products that are enrolled in Amazon Brand Registry. They also show the competitors’ ASINs for the items associated with the brand owner’s registered products.
Opportunity Explorer is available to Professional sellers in the US, Germany, UK, France, Italy, and Spain. If you are not a Professional seller, view the Selling Plan Comparison and upgrade to a Professional account. Within 24 hours after the upgrade, you’ll be granted access to the Product Opportunity Explorer tool.
Summing Up
When it comes to making informed strategic decisions, having access to accurate data is a huge deal. Knowing how to interpret and implement these valuable assets is even more important. By analyzing your brand performance at the ASIN level, you can spot the areas for improvement and take action to:
- build an efficient advertising strategy to outperform the competition;
- level up your product targeting and improve the relevance of your PPC campaigns;
- enhance the descriptions on your product detail page with A+ Content;
- add compelling multimedia content to highlight the unique selling points of your product.
At Seller Labs, we know about the Amazon seller’s primary challenge of juggling multiple tasks simultaneously. And this is where Seller Labs Services can save you time and effort by taking some of them (or even all of them!) off your plate! So if you’d like help with Amazon SEO optimization, need a compelling product description, efficient PPC or Facebook advertising campaign, or a new professional Amazon storefront, we have you covered!


